
Adding New Columns To Existing Epicor Kinetic Screens
TOPICS: Epicor Kinetic Customizations / Application Studio
A frequent request that we will get is to add a new column to an existing data grid or screen within Epicor Kinetic. A recent example was the request to add the customer name to the time-phased inquiry for any sales order rows. Over the years we have taken a variety of approaches to meet this sort of requirement:
There is the brute force approach, where we have used code within classic forms customizations to dynamically add a column on form load and then maintain it via lifecycle events.
There is the sneaky approach, where we take an existing unused column in the grid (hopefully there is one), relabel it, and change the data contents via a post-processing directive.
Or there is the painful approach, where we fully recreate the grid bound to a new EpiDataView holding our new columns alongside the original data.
Of course, the Kinetic migration really has thrown a wrench in the customization-layer heavy approaches. For my latest project, I decided to do this the “new” way and I am pleased with the results. This article ends up mashing up several different concepts from Functions (which I don’t yet have any articles about) to Kinetic Application Studio (read the intro here first if this is new to you).
Building The Data Object
So let’s start by building out the data object we will be working with here. We could have possibly just went straight into a custom BAQ here, but the time phase is pretty complicated so I opted to try to just build on top of it. To do so, I created a Kinetic Function library per the following:


Now for the actual code of the function itself. The code within functions is pretty similar to what you would be used to developing regular BPMs. The biggest difference will the the CallService method calls you see in here - this is a wrapper that just makes it a little easier to call and properly dispose of business objects within your code. So here is the actual code:
this.CallService<TimePhasSvcContract>(timePhas => {
  // Call the standard time phase BO
  TimePhasTableset timePhasTs = timePhas.GoProcessTimePhase(
    this.partNum,
    0,
    this.callContextClient.CurrentPlant,
    true,
    true,
    true,
    ""
   );

   // Convert to a DataSet so we can do whatever we want to it
   DataSet ds = DatasetAdapter.ConvertToGenericDataset(timePhasTs, "", null, true);

   // Add a column for the customer name
   ds.Tables[0].Columns.Add("CustomerName", typeof(string));

   // Now fill that customer name when this is a sales order
   foreach(DataRow dr in ds.Tables[0].Rows) {
    // Only worry about it if the OrderNum column isn't blank
    if (!string.IsNullOrEmpty(dr["OrderNum"].ToString())) {
      // Use the SalesOrder BO to do a GetList to locate the sales order
      this.CallService<SalesOrderSvcContract>(so => {
        bool morePages;
        OrderHedListTableset oh = so.GetList("OrderNum = " + dr["OrderNum"].ToString(), 0, 1, out morePages);

        if (oh.OrderHedList.Count() > 0) {
          dr["CustomerName"] = oh.OrderHedList[0].CustomerName;
        }
      });
    }
   }

   // Finally fill our variable with the results
   this.output = ds;
}
);
As you can see with the comments added in, we are using the Time Phase BO to first generate a time phase for us, then we convert the resulting typed tableset to a generic dataset, add a new column for CustomerName, and then fill it by looking up the sales order and pulling the customer name from there. Last step is to assign the ‘output’ parameter to the dataset we just built. Once your code is in place, promote your function library to production so we can see it from Kinetic.
Create An API Key
The next step will be to create an API key using API Key Maintenance / Access Scope Maintenance. You will want to be certain to authorize this new library for use with this key.

Adding To The Kinetic Application
At this point, you could call this function from anywhere and utilize its output, but since we are trying to live in the “new” here I am going to focus on adding this to the Kinetic Time Phase app. Start by loading up Time Phase in Application Studio (again, if this is new to you please check out this article) and creating a new layer. Within Application Studio we first want to create a brand new view for our new Time Phase grid that adds the customer name:

Now go to Events and locate the one named ColumnChanged_PartNum. Just as with classic forms, there are events that can be added to fire as a column is changing and after a column has changed. This app already had an event defined so I am just adding to that existing event but you also could have created this event from scratch using this same sort of triggering:

But since we are just adding to an existing event here, we can simply add our function by dragging ‘erp-function’ from the toolbox onto the canvas:

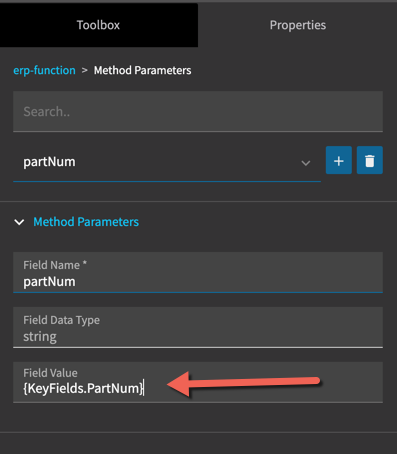
Click on the newly added erp-function object and fill in the following on the properties panel for it:

Now click on Method Parameters and define how our partNum parameter gets populated when we call this function. Here I am telling it to use KeyFields.PartNum, which I determined was an appropriate value by examining the properties of the trigger at the beginning of this event workflow.
Now go get out of this Method Parameters drill down (by clicking the ‘erp-function’ breadcrumb at the top of this properties panel) and drill into response parameters. Here we are determining what to do with the results that come out of our function. In our case, we know that we are expecting a response in the form of a dataset that we’d like to point to that new TimePhaseCustomer data view we just created. Start by pressing the + button and then fill in per the following:

Going down the list, here is what each property is doing:
Parameter Path: This is the name of the output parameter we defined within our function.
Parameter Name: This would be the name of the table within the dataset returned by our function that we wish to point our view to. We didn’t explicitly define this in our function, but recall that we simply piggy-backed off the standard Time Phase BO and this is the name of the table returned by that call.
View Name: This is the new view we defined a few steps back in Application Studio.
Parse from Response Path: To be honest, I am not quite sure of the scenario here where this would differ from Parameter Path but I am sure I will encounter it.
Merge Behavior: Here we decide whether the resulting rows get merged with what is in our new view or it just replaces the rows in there. We want to replace so that the contents are cleared out with each part change.
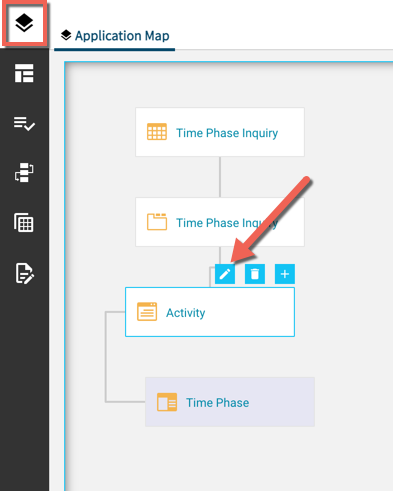
So at this point we actually have the plumbing all in place - now it is just a matter of putting it on the screen. To do so, go to Application Map and edit the Activity page:
In the designer, we want to drag a Panel Grid from the toolbox onto the canvas. Panel Grid is a widget that combines a data grid with the tools to collapse/expand and go full screen - you will be using it a lot in Kinetic:

With the Panel Card Grid added, go to it’s properties and expand out the ‘Data’ section and click on Grid Model:

Then simply fill in the name of the view we defined earlier (TimePhaseCustomer) for the Ep Binding:

Now we are ready to test this out. Hit the save button in the upper corner to save our layer changes and then use the preview button to test it out. Pick a part and see the results:

Yikes! Ok, that is a lot of columns. At least we know it is doing something but we see here that the default behavior of a Panel Card Grid bound to a view is to show all defined columns. To button that up we are going to need to go back to the properties for the Panel Card Grid and drill into Data / Grid Model / Columns. From here we need to spell out exactly which columns we want by pressing the Add button, filling in the column name, and repeating over and over for each column you wish to add. Be mindful of the order you enter these in as that is the order they will display and it is not easy to change (currently):

Once you get all of the columns you want added, return to preview and we will now see a much nicer output:

The remaining cleanup from here was just to add the rest of the columns I wanted, apply the appropriate ‘ERP Editor’ and ‘ERP Editor Model’ properties to control how the columns are displayed, and remove the standard Time Phase grid from the screen.
